
Chart 1
U.S. Army Overseas Deployment, 17 October 1941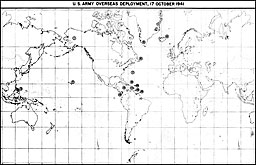
ALASKA Now End 1941 War 1. Officers and men 22,000 22,000 29,000 Airplanes: Bomb (H) 1 8 16 Bomb (M) 15 33 41 Pur 21 46 52 Misc 13 13 -- HAWAII Now End 1941 War 2. Officers and men 42,000 45,000 60,000 Airplanes: Bomb (H) 12 15 170 Bomb (M) 40 40 40 Bomb (L) 21 24 24 Pur 166 166 225 Transport 2 2 20 Misc 29 -- 16 PHILIPPINE ISLANDS Now End 1941 War 3. Officers and men: White 17,000 33,000 35,000 Phil Scouts 12,000 12,000 12,000 Phil Army 25,000 92,000 160,000 Total 54,000 137,000 207,000 Airplanes: Bomb (H) 9 69 165 Bomb (M) 30 0 0 Bomb (L) 9 52 52 Pur 162 226 259 Transport 2 2 -- Misc 22 -- 16 ICELAND Now End 1941 After 1941 4. Officers and men 5,900 6,600 30,000 Airplanes: Pur 31 30 30 Misc 3 -- -- GREENLAND Now End 1941 After 1941 5. Officers and men 700 700 2,500 Airplanes: Bomb (H) 0 0 13 Pur 0 0 25 NEWFOUNDLAND Now End 1941 After 1941 6. Officers and men 2,300 2,600 5,7000 Airplanes: Bomb (H) 6 6 42 Pur 0 25 50 Misc 2 -- -- BERMUDA Now End 1941 After 1941 7. Officers and men 1,300 1,200 3,700 Airplanes: Bomb (H) 0 0 16 Pur 0 0 25 JAMAICA Now End 1941 After 1941 8. Officers and men 15 350 880 Airplanes 0 -- -- PUERTO RICO Now End 1941 War 9. Officers and men 22,000 23,000 42,000 Airplanes: Bomb (H) 0 0 85 Bomb (M) 23 57 129 Bomb (L) 1 -- -- Pur 68 97 180 Misc 15 -- 16 ANTIGUA Now End 1941 After 1941 10. Officers and men 320 350 430 Airplanes 0 -- -- ST. LUCIA Now End 1941 After 1941 11. Officers and men 310 350 430 Airplanes: 0 -- -- TRINIDAD Now End 1941 After 1941 12. Officers and men 2,900 3,600 16,000 Airplanes: Bomb (H) 0 0 85 Bomb (M) 6 6 -- Pur 0 80 163 Misc 1 -- -- BRITISH GUIANA Now End 1941 After 1941 13. Officers and men 330 350 430 Airplanes 0 -- -- PANAMA Now End 1941 War 14. Officers and men 31,000 32,000 50,000 Airplanes: Bomb (H) 7 7 92 Bomb (M) 42 42 42 Bomb (L) 26 30 30 Pur 95 107 190 Transport 7 19 27 Misc 18 -- 16
NOTES
(1) Even before Pearl Harbor, the War Plans Division (WPD) occasionally produced maps, sych as this, presenting a tabulation of Army strength in the overseas bases. On 3 January 1942, WPD began regularly to issue a Weekly Status Map, showing the current and projected area. These maps were continued by WPD's successor, OPD, until the fall of 1944 (for example, Charts 2 and 3). The dta contained in these maps did not necessarily correspond with other statistical records kept in Washington or in the field. But this simplified accounting was the most reliable rough summary on Army deployment readily available to General Marshall and the whole War Department for planning purposes. See Cline, Washington Command Post: The Operations Division, pp. 87, 129-30.
(2) Figures shown as "After 1941" and "War" in Chart 1 are predicitions for the end of 1942.
(3) Dashes (--) in columnns indicate "Unknown."
