yEd Software Dependency Visualisation
Here's an example of the use of the yEd graphing tool to display the requirements of running this archive. Below is the explanation I sent to the tool authors, in case they wanted to include it on their site in the Gallery.
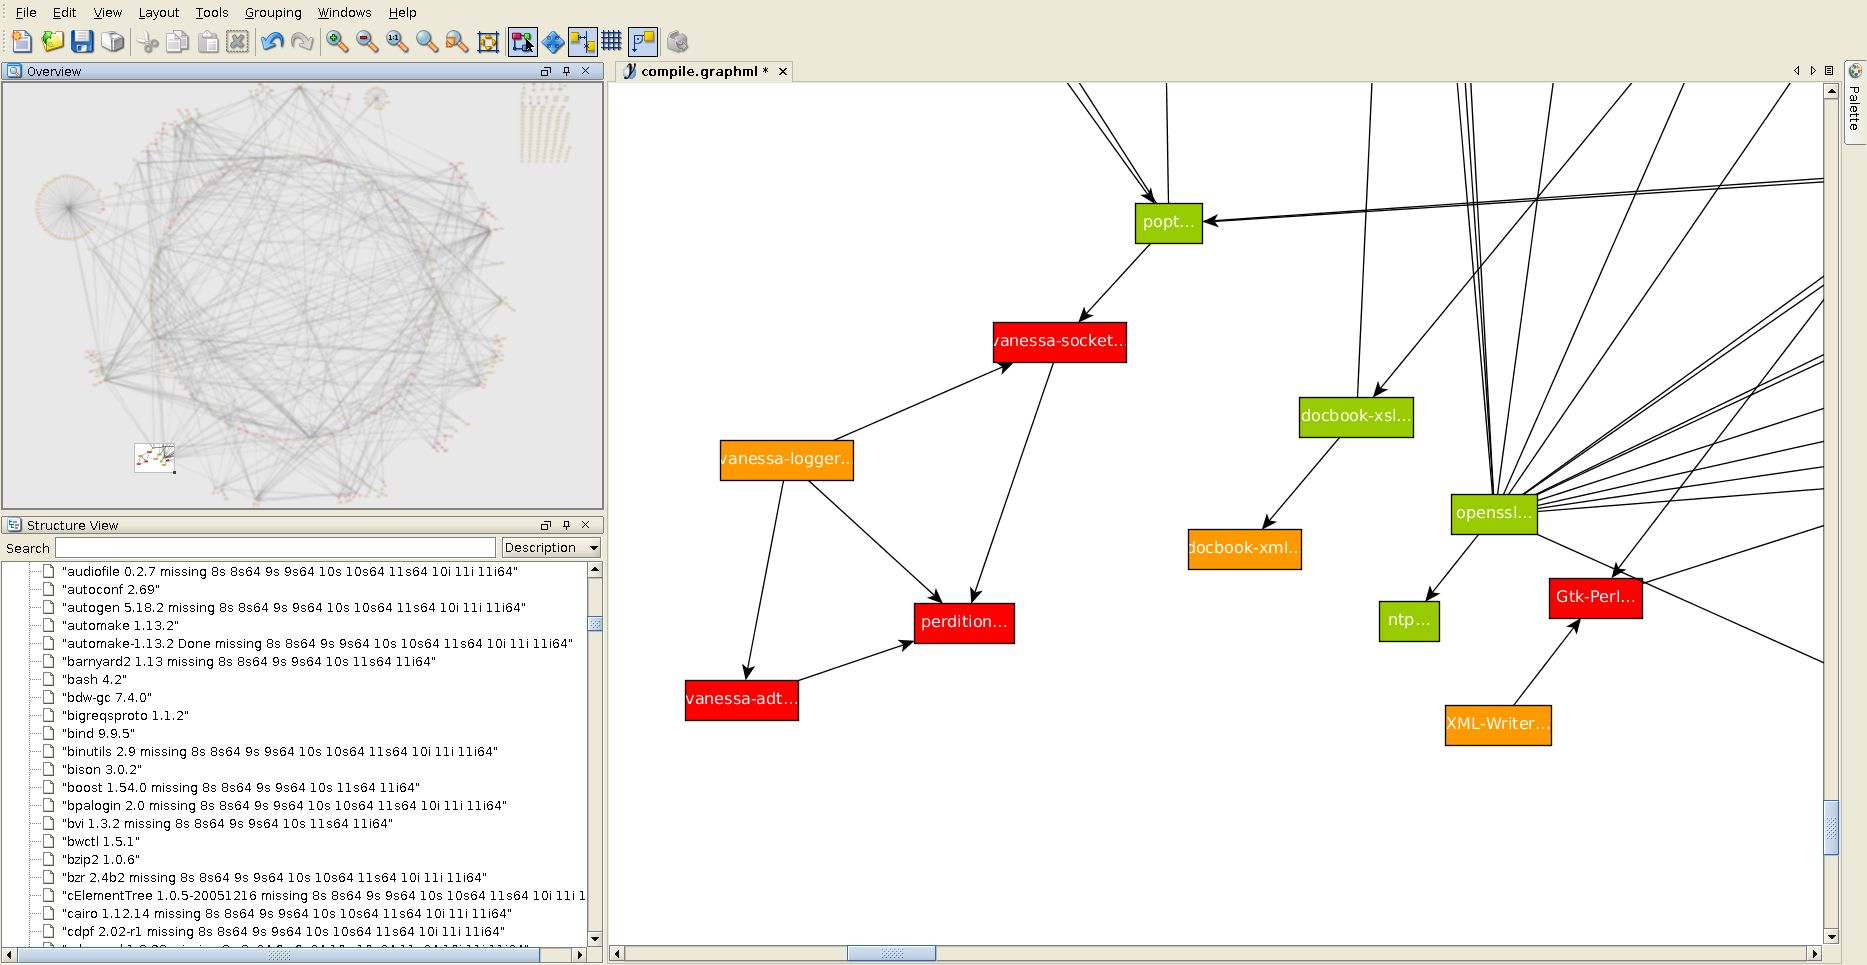
I scanned my software dependencies, finding the latest version of a program, figuring out what was needed to compile the software, analysing what was already done and then outputted each program as a graph node with edges from dependencies to the final software product. Each node is colour coded according to it's status, green for finished, orange for ready to compile (or partially compiled) and red for missing dependencies.
It displays best as a circular graph and I can zoom around the (fuzzy looking) top left Overview window and see the items in the main window. The Overview box shows the sheer scale of everything I've done and what I need to do. The Structure View window is most useful on the Description option, I've used the GraphML node Description tag to have each node show a tooltip when I hover the cursor over it in the main window, plus the node Description content is also viewable at a glance in the Structure listing. I also added checks for missing software for various Solaris O.S. versions, hence the 8s, 8s64, 9s, 9s64 etc attributes. Putting that data in tooltips allows the normal graph to be clear but still allows me to "drill down" into the dataset.
In the Neighbourhood window (I pop it out so I can expand it) I can click through each of the nodes/programs, back and forth, to see what needs to be done. The other windows update so I can view the requriements.
I use a Perl program to read in the ascii file and output in GraphML format, with yEd extensions. I don't do any node x or y plotting, it's easier to let the circular graph option do it for me after I read in the 924KB graph. There's 492 nodes and 713 edges at the moment. Updating takes about five or six seconds to regenerate the GraphML file and read it back in.
So all in all, yEd turns a huge ascii file (in sort of an adhoc YAML format) into a visualization of dependencies which lets me hunt for issues, pick low hanging fruit and work better. The file was getting unwieldy lately and things were getting missed in the spaghetti. Doing this exercise also showed me where the data needed cleaning up as the exceptions became apparent.
The raw data format. It shows which O.S. versions have had a package created.
fontconfig 2.9.0
    http://www.freedesktop.org/software/fontconfig/release/

    Compile libiconv 1.14     Done 26s 7s64 8s 8s64 9s 9s64 10s 10s64 10i 11s64 11i 11i64
    Compile expat 2.1.0       Done     7s64 8s 8s64 9s 9s64 10s 10s64 10i 11s64 11i 11i64
    Compile gettext 0.18.2    Done     7s64 8s 8s64 9s 9s64 10s 10s64 10i 11s64 11i 11i64
    Compile freetype 2.4.9    Done     7s64 8s 8s64 9s 9s64 10s 10s64 10i 11s64 11i 11i64

gtk+ 3.4.0:
    http://ftp.gnome.org/pub/gnome/sources/gtk+/

    Compile pkg-config 0.28        Done     7s64 8s 8s64 9s 9s64 10s 10s64 10i 11s64 11i 11i64
    Compile freetype 2.4.9         Done     7s64 8s 8s64 9s 9s64 10s 10s64 10i 11s64 11i 11i64
    Compile fontconfig 2.9.0       Done
    Compile renderproto 0.9.2      Done
    Compile libXrender 0.9.6       Done
    Compile libXft 2.3.1           Done
    Compile libXfixes 5.0          Done
    Compile libXcursor 1.1.11      Done
    Compile glib 2.41.0            Done          8s 8s64 9s 9s64 10s 10s64 10i 11s64 11i 11i64
    Compile atk 2.4.0              Done
    Compile pango 1.30.0           Done
    Compile gdk-pixbuf 2.26.0      Done
The yEd window: